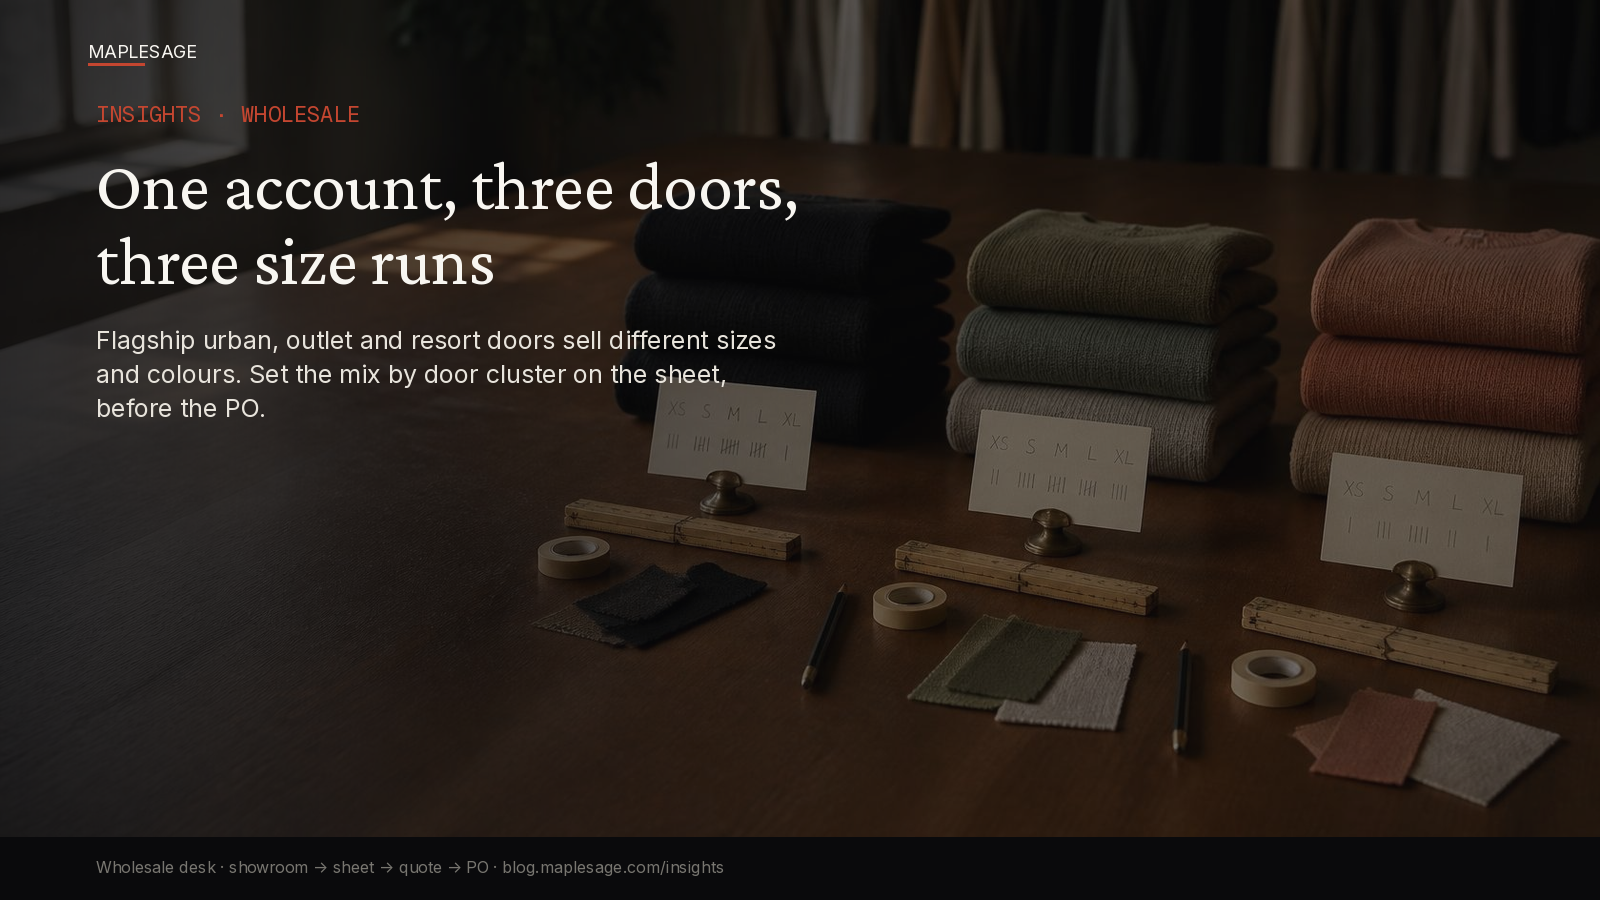
One account, three doors, three size runs. An averaged curve fits none of them.
The buy meeting goes well. The retailer’s buyer commits to the style at depth across twelve doors, the rep writes one size curve on the order, and everyone moves on. It’s the curve the brand always uses for that category: a sensible bell across the core sizes with thin tails.
Six weeks into the season the account’s urban flagship is out of the core sizes and asking for a replenishment that can’t be cut in time. The outlet is sitting on the small end. The resort doors sold through the bright colourway in two weeks and have the dark one on the floor at markdown. The buyer’s season review blames the product. It was the size mix.
This follow-up sits on the spine: showroom → account-aware line sheet → quote → size/assortment → approved PO. Day 3 put size curves on the wholesale sheet instead of the returns dashboard. Day 10 used account history as assortment logic. This one goes a level down: an account isn’t one door. The size mix has to be set by door cluster, on the sheet, before the PO commits.
The misuse
Most wholesale teams plan size at the account level. The account has a curve, the curve goes on every line, and the units split across doors in proportion to door count or door volume.
That only works if the account’s doors look alike. For most mid-market AFL brands they don’t. A typical specialty or department-store account mixes door types that behave differently:
- Flagship urban doors: high traffic and fast full-price sell-through, deeper in the core sizes, earlier on new colour, the first to run out of the middle of the curve
- Outlet doors: price-led, a broader and flatter curve, more weight at the edges, slower on fashion colour and stronger on the carryover
- Resort and seasonal doors: short windows tied to the local season, a different colour story, often a different fit and size skew, and very little room to replenish once the window opens
Put one averaged curve across all three and every door gets the wrong mix. The flagship is short in the core, the outlet is long on sizes it doesn’t move, and the resort door gets a colour and size balance built for a city in a different month.
Nobody chose this. The sheet simply had nowhere to put a door-level mix, so the rep wrote the one curve they had, and the PO inherited it.
Account curve vs door-cluster mix
| Moment | One curve per account | Size mix by door cluster |
|---|---|---|
| Line sheet | One size run shown for the style | Size run shown per door cluster for that account |
| Buy meeting | Buyer commits units; curve assumed | Buyer commits units per cluster with each cluster’s curve visible |
| Colourway | Same colour split for every door | Colour split set per cluster (resort and outlet differ from flagship) |
| Quote | One line per style and colour | Lines carry the cluster split, so units and sizes are explicit |
| ATP check | Checked against the total | Checked per cluster and ship window, so resort’s early window is real |
| PO | One allocation, split later by the retailer or the brand’s ops team | PO lines split by cluster from the approved quote |
| In season | Flagship stocks out; outlet marks down | Fewer core stock-outs and fewer edge-size markdowns, because the mix matched the doors |
| Season review | “The style didn’t work” | Sell-through read by cluster, which feeds next season’s sheet |
The account-level desk asks: how many units? The door-cluster desk asks: how many units, in which sizes and colours, for which kind of door, shipping when?
Why one averaged curve is too expensive
An averaged curve feels conservative. It quietly carries three costs:
- The stock-out cost. The doors that sell fastest run out of the middle of the curve first. Replenishment arrives late or not at all, and the brand loses full-price sales it had already earned in the buy meeting.
- The markdown cost. The doors that move slower and wider sit on the sizes and colours they were never going to sell. Those units come back as markdown money, returns or chargebacks, and the margin conversation lands on the brand.
- The planning cost. When the PO doesn’t carry the door split, someone rebuilds it after the fact: the retailer’s allocator, the brand’s ops team or the rep in a spreadsheet. Every rebuild is a chance to get it wrong, and none of it is visible on the quote finance approved.
Related: Size Curves Belong on the Wholesale Sheet. Account History Is Assortment Logic. ATP on the Buy. Door Terms Belong on the Sheet. The PO Is Not a Form. Full spine: The Wholesale Season Breaks When the Sheet Stops Being the System.
What has to be true for door-level size mix to work
Door-level mix only helps when it lives on the same object the buy and the PO are built from:
- Doors grouped into clusters on the account: flagship urban, outlet, resort or whatever clusters the account really has, maintained with the account, not rebuilt every season
- A curve and colour split per cluster on the sheet: the buyer sees each cluster’s size run and colour balance next to the style, before committing
- History by cluster, not just by account: last season’s sell-through and returns read per cluster, so the starting curve is evidence and not habit
- Windows per cluster: resort and seasonal doors carry their own ship windows, checked against availability at the buy
- The quote carries the split: units by cluster, size and colour on the lines being approved, so the approval covers the mix and not just the total
- The approved quote becomes the PO: the cluster split flows to the PO lines without re-keying or a separate allocation spreadsheet
- Overrides are visible: when the buyer or rep changes a cluster’s curve, the change is on the quote with who and when, so the season review can learn from it
When those live on the sheet and the quote, the buyer commits to a mix that matches the doors. When they don’t, the brand ships one curve to three kinds of store and finds out which was wrong at markdown time.
ICP framing
For mid-market AFL brands selling to retailers (roughly $10M to $250M wholesale), whether size mix is set per door cluster or per account is an input to:
- how often the fastest doors run out of core sizes mid-season
- how much markdown money, returns and chargeback exposure sits in edge sizes and off-season colour
- how much allocation work gets rebuilt after the PO by the retailer or the brand’s ops team
- whether next season’s sheet starts from cluster sell-through or from last year’s account average
It isn’t a new allocation tool bolted on after the order, a bigger size-curve spreadsheet or a request that buyers send their own door splits by email.
Heads of wholesale feel it when the season review shows the same style selling out in one door and marking down in another, under the same account and the same PO.
Product proof note: the Retail-OS wholesale path
MapleSage Retail-OS keeps the line sheet and the quote as one account-aware commercial object from the showroom to the PO. Door clusters, size curves, colour splits and ship windows sit on the account’s sheet at the buy, the quote carries the split and the approved revision converts to the PO.
See the buyer path: b2b.maplesage.com. Wholesale surface: www.maplesage.com/retail/wholesale/. Talk: go.maplesage.net.
What we won’t pitch
- “One curve per category, everywhere” as size planning
- A post-season allocation report as a substitute for getting the mix right at the buy
- Size-matrix or competitor allocation-screen screenshots as the hero
Next step
Pick one account with mixed door types and one style from last season. Compare sell-through by size in its fastest door and its slowest door. If the curves look different, they belong on the sheet as different curves, before the buyer commits.