The size curve that matters is the one on the order, not the one in the post-mortem.
Every wholesale brand has a size dashboard. Sell-through by size. Returns by size. Chargebacks by size. It is accurate, and it arrives in March for a buy that was written in September.
The dashboard tells you the curve was wrong. It cannot change the units already cut.
What the post-return view misses
- It is late. The order window, the cut and the ship are all behind you.
- It is by brand, not by account. A flagship in a city and a regional chain do not buy the same curve. An average hides both.
- It blames the wrong party. Returns look like a retailer problem. Often the buyer took the default run from your line sheet because nothing better was on it.
- It cannot be acted on. You can adjust next season. You cannot adjust this one.
Where the curve actually gets set
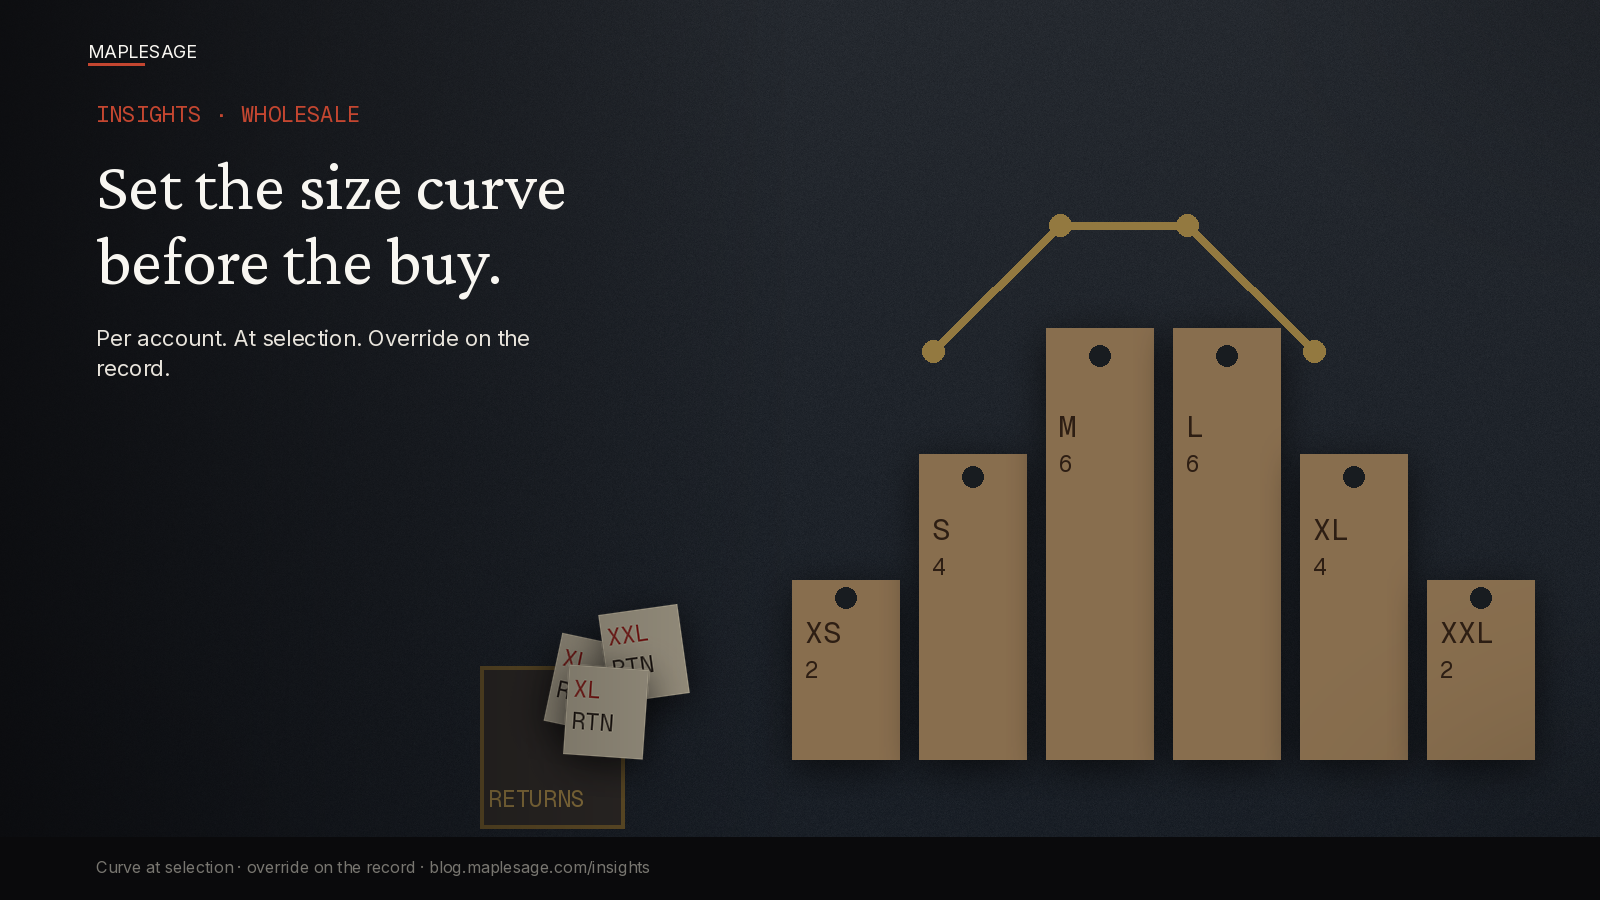
It is set at selection. A buyer opens the sheet, picks a style, and accepts a size run. If the run on the sheet is a flat 2-4-6-6-4-2 for every door, that is the curve you will ship, whatever the dashboard says later.
So the lever is not reporting. It is what the buyer sees at the moment they choose.
What a pre-buy curve is
A pre-buy curve is a recommended run per style and per account, shown at selection, built from that account’s own history.
| Input | Example |
|---|---|
| Account | Regional chain · 14 doors |
| Style | AFL-2064 Navy |
| Last two seasons | Sold through S and M first, L carried over |
| Recommended run | 4-6-6-4-2-0 |
| Default run | 2-4-6-6-4-2 |
| Reason | XL and XXL sold under 40% in both seasons |
The buyer can override it. But the override is a visible choice, not an accident of the default.
Three rules for the pre-buy curve
1. Build it per account, not per brand. Use the account’s last two seasons where it has them. Fall back to a similar account type, then to the brand curve. Say which one you used.
2. Show it where the choice is made. On the line sheet, the selection and the quote. Not in a report the buyer never opens.
3. Record the override. If a buyer takes the default over the recommendation, keep that. When returns come back, you can tell a bad curve from a bad choice.
What changes
First, fewer returns by size. The units that would have come back are never bought.
Then, cleaner reorders. Each account’s curve improves every season, because the sell-through feeds the next recommendation.
Then, an honest conversation with buyers. “You overrode the run on 12 styles” is a fact. “Your returns are high” is an argument.
A one-week test
Pick your top five accounts and one core style. For each, write down the run they ordered and the run they actually sold.
- Is the ordered run the sheet default?
- Does the sold run differ by more than one size band?
- Can you pull both numbers in under ten minutes?
If the buyer took the default and the sell-through disagrees, the curve was set by the sheet, not by the account.
The short version
Dashboards explain last season. A curve at selection changes this one. Build it per account, show it where the buyer chooses, and record the override.
MapleSage Retail-OS keeps the wholesale spine in one place: sheet → selection → quote → PO → production. More Insights at blog.maplesage.com.