
#Personalization
#fashiontrend
AthleticWear

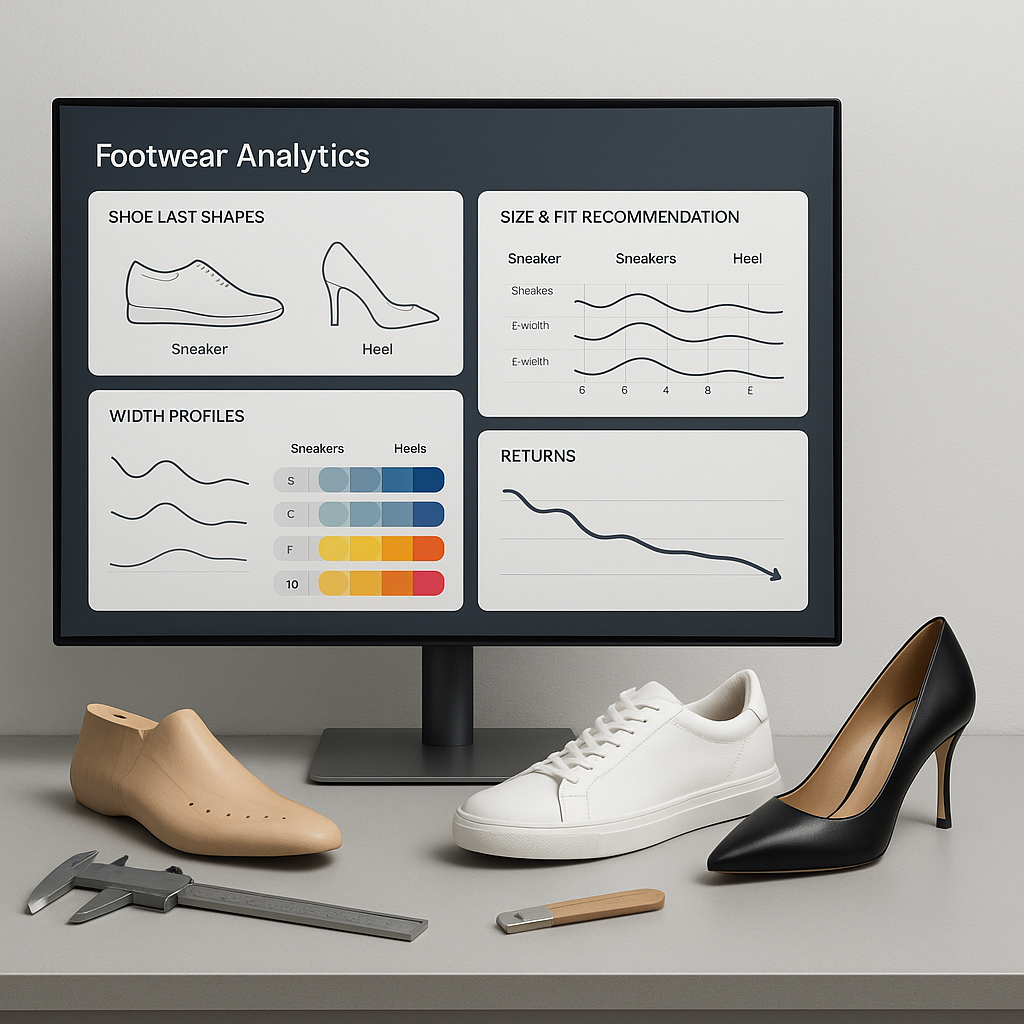
A footwear-specific blueprint: last and width intelligence that cuts returns.
Footwear concentrates the pain of online returns: high fit sensitivity, idiosyncratic sizing by last and brand, and bracketing behavior that bloats reverse logistics. A stunning silhouette can’t overcome a slipping heel or a too‑narrow forefoot.
Many PDPs still rely on generic size charts and static “fits true to size” statements, leaving shoppers to guess. The result is multi-size orders, refund leakage, and loyalty erosion. To fix this, treat footwear fit as a first‑class domain with its own data and signals.
Start with the biomechanics that actually change comfort. Last shape and width (B/D/E for many brands), instep height, toe box geometry, heel counter stiffness, and materials/stretch determine how a shoe feels on foot. For athletic styles, stack height and rocker profile matter; for dress and luxury, heel height and shape change balance and stride.
Encode these as structured attributes at the SKU level instead of burying them in copy, and map them to shopper preferences gathered explicitly (“narrow heel,” “wide forefoot,” “max 70 mm heel”) and implicitly from prior purchases and returns. When the model outputs a single, confident recommendation with a short reason—“We recommend 42.5 — last runs slightly narrow; your past purchases suggest 42.5 in similar lasts”—bracketing drops.
Evidence from industry syntheses shows apparel and footwear returns remain stubbornly high online and are primarily driven by fit and expectation gaps. Coresight summarizes the cost and prevalence of returns in fashion e‑commerce: Coresight Research.
Macro outlooks from BoF and McKinsey highlight value‑seeking behavior and the need to protect margin through precision in CX and merchandising; see the 2025 report: State of Fashion 2025. Combine these realities with footwear‑specific UX lessons on conveying fit and feel—Baymard’s research offers a rigorous benchmark: Baymard Footwear UX.
Design the intelligence and UX together so they explain themselves. Data: capture last shape and width, instep height, toe box geometry, heel counter stiffness, materials and stretch, closure type, and category (performance runner, court, lifestyle, dress).
Ingest availability‑aware sales (so stockouts don’t read as low demand) and return reasons with granularity (“heel slips,” “toe box too tight,” “arch pressure”). Use these to train a model that emits one recommended size with a short reason and a confidence band, borrowing learning from sibling SKUs (same last or material) to handle cold‑start styles.
UX: place the size badge above the fold on PDPs and carry it into cart. Flag redundant sizes and propose a single alternate when confidence is low (“Try 43 for wider forefoot”). Pair fit with style coherence to reduce “change‑of‑mind” returns: an outfit strip that respects the shopper’s saved silhouettes and palettes helps ensure the shoe matches their wardrobe, not just their foot. Visuals should show the shoe on foot from angles that highlight heel hold and toe profile; short video loops help buyers judge movement and flex.
For footwear and broader PDP guidance, see Baymard’s product page research: Baymard PDP UX. Tie returns recovery to exchanges‑first flows. When fit issues persist, route disappointed buyers to an exchange path that defaults to the most comfortable size or a close last with a clear reason code. Make the exchange path faster than refunds. Research and retailer playbooks emphasize that post‑purchase guidance and clear options curb refunds; for accessible summaries, see Klaviyo and operational guidance via Baymard.
Run the program like a product with CFO‑ready evidence and clear guardrails. Scoreboard outcome KPIs: return‑rate delta on influenced orders, multi‑size order share, exchange vs. refund mix, AOV and units per transaction (when outfitting accompanies fit), and size‑related contact rate.
Complement with journey KPIs: size badge view → duplicate size removal in cart; exchange portal view → exchange selection; post‑purchase styling click → repeat visit. Attribute at the node, not the channel.
Experiment design: start with the categories most sensitive to fit—performance runners, court shoes, luxury pumps—across two regions. Prefer randomized control at session or user level; otherwise use matched cohorts with pre‑registered stop‑loss thresholds. Expect the largest impact where last shape and width vary significantly by brand.
Publish weekly readouts that reconcile recovered revenue and reduced reverse‑logistics costs with any incentives (e.g., free fast shipping on exchanges for VIPs). Reliability and governance: version your fit model and persist an audit trail (inputs, reason codes, outcomes); refresh weekly as returns and exchange telemetry arrive. Maintain privacy as a performance feature: evaluate consent at activation for any personalized block and minimize PII in decision payloads—fetch only minimal context (size band, last preference, budget).
Keep content accessible and premium: concise copy for contemporary, editorial restraint for luxury, and capsule‑led suggestions for athletic. As macro reference points on fashion economics and why precision matters in 2025, see the State of Fashion 2025. With footwear-specific fit intelligence and explainable UX, you replace guesswork with confidence—and keep revenue in-house.
